
Data Analytics Business Dashboards
Turn Business Data Into Clear Decisions
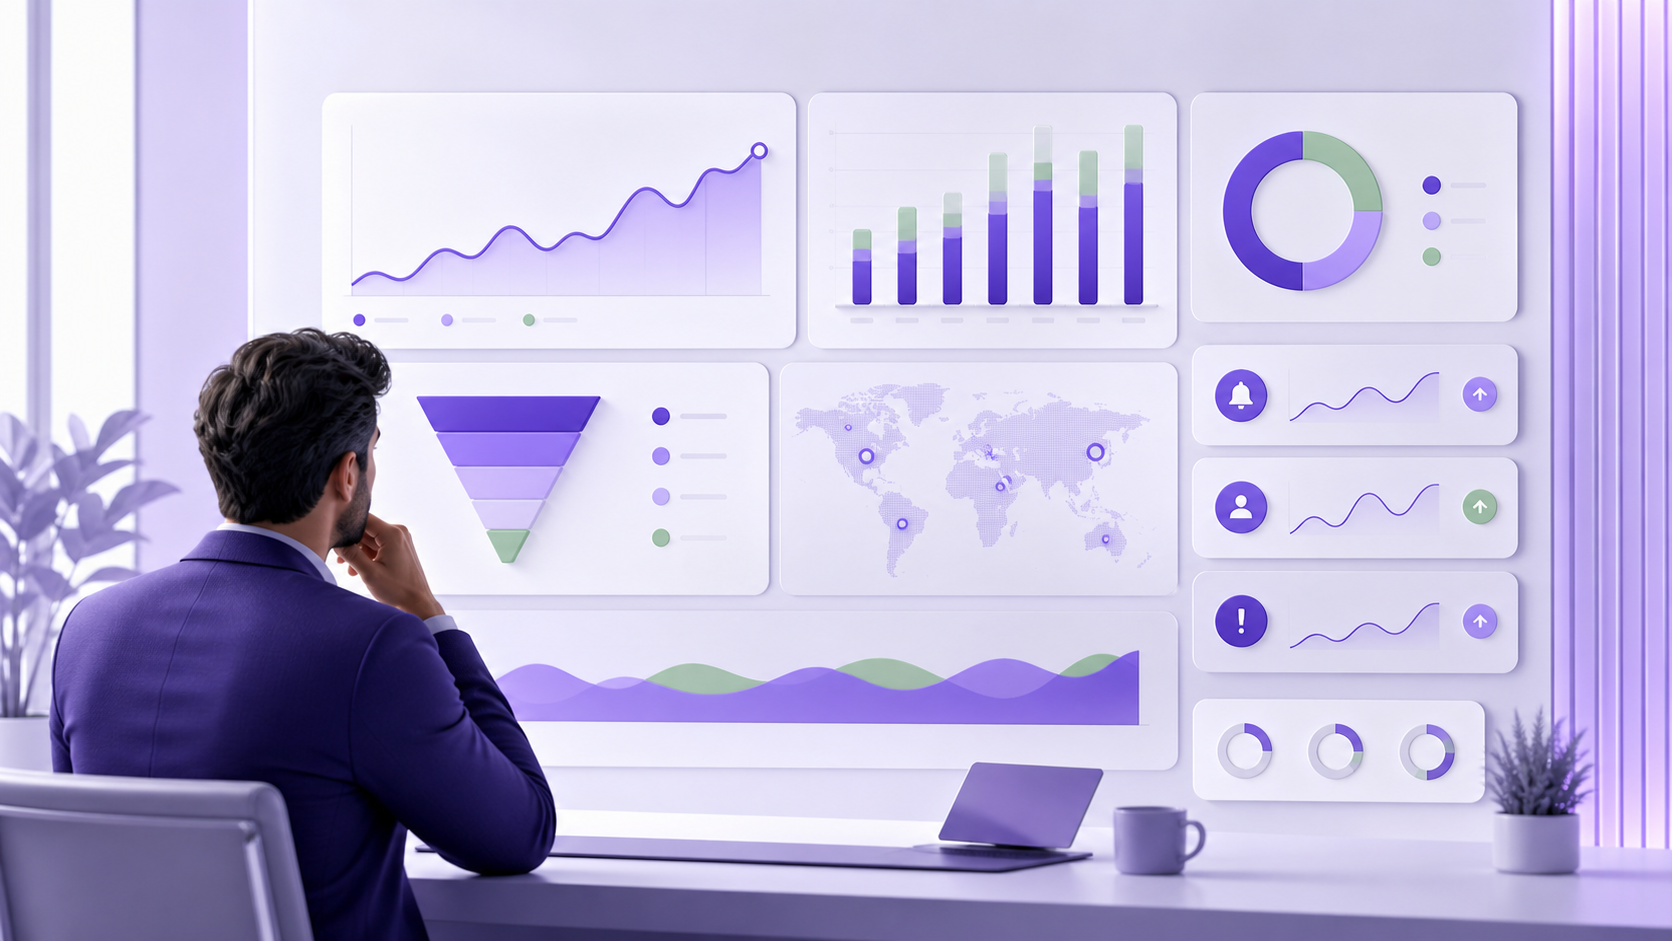
Our data analytics business dashboards combine practical dashboards, automated reports and focused analysis that help growing businesses see what is happening—and what needs attention next.
Data analytics and business dashboards built for decisions
We organize business data around the questions your team actually needs to answer, then create clear outputs that are easy to maintain and act on.
Sales & Revenue Dashboards
Track pipeline, revenue, trends and performance against meaningful targets.
Customer Analytics
Understand customer activity, segments, retention and operational follow-up needs.
Operations Reporting
Make workload, turnaround times, exceptions and bottlenecks easier to see.
KPI Design
Define practical measures that reflect business outcomes instead of vanity numbers.
Data Cleaning & Preparation
Turn inconsistent spreadsheets and exports into reliable analysis-ready datasets.
Automated Reports
Reduce repetitive reporting through scheduled workflows, alerts and data refreshes.
Connect analytics with business automation
Dashboards show what happened. Automation helps your team respond. Where useful, we connect reports to n8n workflows for notifications, follow-ups, data movement and exception handling.
From business question to trusted dashboard
Define
Agree on decisions, users and success measures.
Prepare
Review sources and clean the required data.
Build
Create and validate reports with real scenarios.
Automate
Schedule refreshes, alerts and repeatable delivery.
Reporting that connects numbers to action
A useful dashboard is more than a collection of charts. It gives each user enough context to understand performance, investigate exceptions and decide what to do next. We begin with the business questions, then map each KPI to a reliable source, an owner and an expected response.
One clear definition for every KPI
We document calculation rules, filters, refresh timing and ownership so teams do not spend meetings debating which number is correct.
Views designed around real decisions
Executives, managers and operational teams need different levels of detail. We organise summaries and drill-downs around the decisions each audience makes.
A maintainable reporting process
Data sources, transformations and refresh steps are documented. Where appropriate, alerts and delivery workflows reduce repetitive manual reporting.
Our data analytics business dashboards can support sales, customer, finance and operations reporting. For examples of the wider technical experience behind our work, visit our case studies.
Data analytics project questions
What data sources can you use?
We can work with spreadsheets, CSV exports, databases and common business systems. We begin by reviewing data quality, ownership and the decisions the dashboard must support.
Which dashboard tools do you support?
We select practical tools around your existing workflow, reporting needs and budget. The goal is a maintainable dashboard your team can understand and use confidently.
Can reporting be automated?
Yes. Where suitable, we automate data preparation, refresh schedules, alerts and report delivery so your team spends less time assembling recurring reports.
Start with one reporting challenge
Focused dashboard and reporting engagements can start from $500. We define the data sources, deliverable and acceptance criteria before work begins.
Before launch, we also agree how the dashboard will be reviewed: who owns each KPI, what threshold triggers action, and how exceptions are escalated. This keeps reporting connected to measurable business outcomes and gives your team a repeatable operating rhythm.
Which KPIs belong on your dashboard?
Use our practical framework to select decision-focused business metrics.
Read the article →